A month or so ago I posted two versions of Obama by the numbers. The first, which every conservative should print out and hand to a independent voter spells out the story in an easy to read and compelling graphic formula. The second is a line by line refutation of the claim that the economy is getting better.
Below are some new numbers to add to the mountain of evidence which documents the economic disaster wrought by Obama and the Democrats. I like the last number best: "0: Other People Obama Will Have Left To Blame For The Failures Of His Economic Policies In 2012."
The Big Fail - Obama By The Numbers
$45.1 Trillion: Total Federal Spending Proposed By Obama’s FY2012 Budget Through 2021. (OMB, 9/1/11)
$24.0 Trillion: Projected Federal Debt In 2021 Due To Obama’s Binge Spending. (OMB, 9/1/11)
$15.3 Trillion: Current National Debt ($15,351,406,294,640.49). (U.S. Treasury Department, Accessed 2/6/12)
$9.1 Trillion: Amount Obama’s FY2012 Budget Would Add To The Debt Through FY2021. (OMB, 9/1/11)
$6.4 Trillion: Cumulative Deficits Caused By President Obama’s Deficit Reduction Proposal. (OMB, 9/19/11)
$5.2 Trillion: Total Interest Payments On The National Debt Due To Obama’s Proposed Budget, FY2012-2021. (OMB, 9/1/11)
$4.7 Trillion: Added To The National Debt Since Obama Took Office. (U.S. Treasury Department, Accessed 2/3/12)
$2.6 Trillion: True Cost Of ObamaCare Once Fully Implemented. (Office Of The Speaker Of The U.S. House Of Representatives, Report, 1/6/11)
$1.75 Trillion: Annual Cost Of Federal Regulations. (Small Business Administration, September 2010)
$1.57 Trillion: Tax Hikes In Obama’s Deficit Reduction Proposal. (OMB, 9/19/11)
$1.416 Trillion: Federal Budget Deficit For FY2009 – Highest In U.S. History. (CBO, 10/7/10)
$1.334 Trillion: Projected FY2012 Budget Deficit Under Obama’s “Deficit Reduction” Proposal. (OMB, 9/19/11)
$1.298 Trillion: Federal Budget Deficit For FY2011 – Second Highest In U.S. History. (CBO, 10/7/11)
$1.294 Trillion: Federal Budget Deficit For FY2010 – Third Highest In U.S. History. (CBO, 10/7/10)
$1.13 Trillion: American Debt Held By China. (U.S. Treasury Department, Accessed 1/9/12)
$1.079 Trillion: Projected FY2012 CBO Baseline Deficit. (CBO, 1/31/12)
$825 Billion: Price Tag Of Obama’s First Failed Stimulus. (CBO, 8/24/11)
$763 Billion: Net Interest Payment On Our National Debt In 2021 Due To Obama’s Proposed Budget. (OMB, 9/1/11)
$575 Billion: Amount Of Medicare Cuts In ObamaCare. (CMS Chief Actuary Richard S. Foster, Memo, 4/22/10)
$535 Million: Stimulus Loan To The Failed Solar Company Solyndra. (The Oakland Tribune, 11/4/10)
$491.7 Billion: Amount Of Taxes In ObamaCare. (Letter to Speaker Nancy Pelosi, 3/18/10; Joint Committee On Taxation, 3/2/10)
$447 Billion: Price Tag Of Obama’s Second Stimulus. (The White House, 9/8/11)
$347.1 Billion: Debt Service Costs For Borrowing To Pay For Obama’s First Stimulus. (CBO, 1/27/09)
$231 Billion: Burden Of New Regulations Imposed In 2011. (American Action Network, 1/2/12)
$175 Billion: Increased Spending In Obama’s Second Stimulus. (CBO, 10/5/11)
$141 Billion: Taxpayer Funds For Fannie Mae And Freddie Mac. (The Hill, 10/27/11)
$23.8 Billion: Amount Government Expects To Lose On Bailouts Of Auto Industry. (The Detroit News, 1/30/12)
$24 Billion: Stimulus Funds Sent To Tax Cheats. (Government Accountability Office, April 2011)
$1.3 Billion: Amount Taxpayers Will Not Recover From Bailout Of Chrysler. (FactCheck.org, 6/6/11)
133 Million: Annual Paperwork Burden Hours Imposed By Regulators In 2011. (American Action Network, 1/2/12)
$77.4 Million: Obama Campaign Cash Raised By Bundlers. (ABC News, 1/31/12)
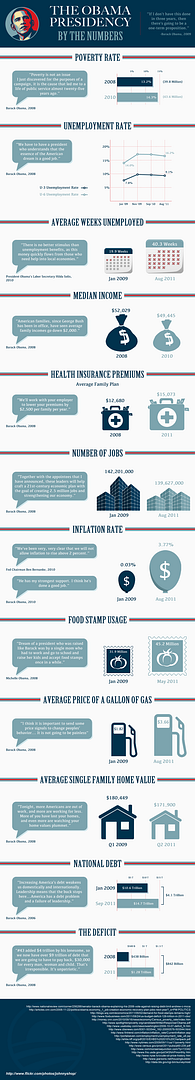
49.1 Million: Number Of Americans Living In Poverty (Supplemental Poverty Measure). (US Census Bureau, 11/7/11)
46.2 Million: Record Number Of Americans Living In Poverty (Official Measure). (U.S. Census Bureau, 9/13/11)
46.1 Million: Record Number Of Americans Receiving Food Stamps. (Department Of Agriculture, 2/1/12)
$18 Million: Cost Of The Stimulus Website Recovery.org. (ABC News’ “The Note“ Blog, 7/8/09)
$15.6 Million: Amount Obama Has Raised From Wall Street – More Than All The GOP Candidates Combined. (Dan Eggen And T.W. Farnam, “Obama Still Flush With Cash From Financial Sector Despite Frosty Relations,” The Washington Post, 10/19/11; TW Farnam, “MF Global Ties Awkward For Obama Campaign,” The Washington Post, 11/2/11)
12.8 Million: Unemployed Americans. (Bureau of Labor Statistics, Accessed 2/3/12)
8.2 Million: Americans Working Part-Time For Economic Reasons. (Bureau of Labor Statistics, Accessed 2/3/12)
7.7 Million: Foreclosure Filings Since Obama Took Office. (RealtyTrac, Accessed 1/9/12)
6.3 Million: Number Of Americans That Fell Into Poverty Since Obama Took Office. (U.S. Census Bureau
6.2 Million: Number Of Mortgages Either 30 Days Delinquent Or In Foreclosure. (Lender Processing Services, 1/19/12)
5.5 Million: Americans Unemployed 27 Weeks Or Longer. (Bureau of Labor Statistics, Accessed 2/3/12)
$5 Million: Obama Campaign Cash Raised By Bundlers In The Lobbying Industry. (The New York Times, 10/27/11)
3.6 Million: Workers Granted Waivers So That ObamaCare Would Not Outlaw Their Health Care Plan. (HHS.gov, Accessed 1/9/12)
2.3 Million: Foreclosure Starts During 2011. (Lender Processing Services, 1/20/12)
1.59 Million: Personal Bankruptcies In 2010. (United States Courts, 2/15/11)
$1.5 Million: Stimulus Funds Sent To Indonesia To Discourage Air Pollution In Jakarta. (The Daily Caller, 7/7/11)
1.47 Million: Personal Bankruptcies In 2009. (United States Courts, 2/15/11)
1.35 Million: Personal Bankruptcies In 2011. (Los Angeles Times, 1/5/12)
1.2 Million: Jobs Lost Since Obama Took Office. (Bureau of Labor Statistics, Accessed 2/3/12)
1.1 Million: Americans That Have Given Up Looking For Work. (Bureau of Labor Statistics, Accessed 2/3/12)
986,000: Construction Jobs Lost Since Obama Took Office. (Bureau of Labor Statistics, Accessed 2/3/12)
690,000: Manufacturing Jobs Lost Since Obama Took Office. (Bureau of Labor Statistics, Accessed 2/3/12)
549,000: Private Sector Jobs Lost Since Obama Took Office. (Bureau of Labor Statistics, Accessed 2/3/12)
428,000: Jobs Lost Since Obama’s Stimulus Was Passed. (Bureau of Labor Statistics, Accessed 2/3/12)
$278,000: Cost Per A Stimulus Job. (The Weekly Standard, 7/6/11)
176,000: Private Sector Jobs Lost Since Stimulus Was Passed. (Bureau of Labor Statistics, Accessed 2/3/12)
149,900: Number Of Local Government Education Jobs Lost Since Obama Signed A $10 Billion Teacher Union Bailout He Said Would Save 160,000 Teacher Jobs. (Bureau of Labor Statistics, Accessed 2/3/12; The Washington Post, 8/10/10)
89,000: The Number Of Stimulus Checks Sent To Dead Or Incarcerated People. (The Wall Street Journal, 10/7/10)
81,405: Record Number Of Pages Added To The Federal Register In 2010. (Competitive Enterprise Institute, 2011)
66,800: Number Of Heavy And Civil Engineering Construction Jobs Lost Since The Stimulus Was Passed. (Bureau of Labor Statistics, Accessed 2/3/12)
$49,655: Your Share Of The National Debt. (U.S. Treasury Department Accessed 2/3/12; U.S. Census Bureau, Accessed 2/3/12)
45,696: Pages Of New Rules Added To The Federal Register During Obama’s First Two Years In Office. (Competitive Enterprise Institute, 2011)
23,000: The Number Of Jobs Obama Knew His Drilling Moratorium Would Kill. (The Wall Street Journal, 8/21/10)
$15,500: Annual Cost Per Household From Federal Regulations. (Small Business Administration, September 2010)
$15,235: Increase In Your Share Of The National Debt Since Obama Took Office. (U.S. Treasury Department Accessed 2/3/12; U.S. Census Bureau, Accessed 2/3/12)
$11,300: Negative Effect Of Debt On Gross National Product Per Person In 2035. (CBO, 6/22/11)
$10,585: Cost Per Employee That Federal Regulations Place On Small Businesses. (Small Business Administration, September 2010)
3,700: Number Of Tax Delinquents Who Received Stimulus Funds. (Government Accountability Office, April 2011)
2060: Year Federal Spending Will Reach 50 Percent Of GDP. (CBO, 6/22/11)
2037: Year That Federal Debt Will Reach 200 Percent Of GDP. (CBO, 6/22/11)
2036: Year That The Social Security Trust Fund Will Be Exhausted. (The Trustees Of Social Security & Medicare, 5/10/11)
2022: Year That The CBO Predicts Medicare’s Trust Fund Will Be Exhausted. (CBO, 1/31/12)
1,722: Number Of Waivers Granted To Unions And Businesses So That ObamaCare Would Not Outlaw Their Health Care Plans. (HHS.gov, Accessed 1/9/12)
1,603: Number Of Regulations That Would Impact Small Businesses Proposed By Obama Administration In First Two Years In Office. (Competitive Enterprise Institute, 2011)
1,014: Days Since Harry Reid’s Senate Has Passed A Budget Resolution. (S. Con. Res. 13, Roll Call 173; 4/29/09)
408: Number Of Regulations Proposed By Obama During First Two Years That Have An Economic Impact Of Over $100 Million. (Competitive Enterprise Institute, 2011)
104: Current Or Former Registered Lobbyists In The Obama Administration. (Center For Responsive Politics, Opensecrets.org, Accessed 2/6/12)
94.2%: Federal Debt Held By The Public As Share Of GDP In 2021. (CBO, 1/31/12)
92: Number Of Bank Failures In 2011. (FDIC, Accessed 2/3/12)
89%: Americans Who Rate The Economy As “Not So Good” Or “Poor.” (The Washington Post/ABC News Poll, 2/6/12)
80%: Small Businesses That Could Be Forced To Change Health Care Plans As A Result Of ObamaCare. (NFIB, 7/11)
79%: Stimulus Funds For Wind, Solar And Geothermal Energy Projects That Went To Foreign Firms. (Investigating Reporting Workshop/ABC’s World News Tonight/Watchdog Institute, 2/8/10)
72.5%: Federal Debt Held By The Public As Share Of GDP By End Of The Year. (CBO, 1/31/12)
72%: Americans That Are Worried The Economy Will Get Worse Rather Than Better Over The Next Year. (Gallup, 1/25/12)
70%: Americans That Say The Country Is Headed In The Wrong Direction. (CNN, 12/23/11)
65%: Voters Who Say The Nation Is On The Wrong Track. (CBS, 1/9/12)
57%: Americans Worried That The Value Of Their Home Won’t Increase. (Gallup, 1/25/12)
51%: Americans Worried About Maintaining Their Standard Of Living. (Gallup, 1/25/12)
48.5%: Households That Receive Some Form Of Government Assistance. (The Wall Street Journal, 10/5/11)
44.8%: Top Tax Rate By 2014 Under Obama’s FY2012 Budget. (The Washington Post, 5/16/11)
44.5%: Increase In National Debt Since Obama Took Office. (U.S. Treasury Department Accessed 2/3/12)
44%: Americans Who Approve Of Obama’s Handling Of The Economy. (The Washington Post/ABC News Poll, 2/6/12)
40.1: Number Of Weeks That It Takes To Find A Job. (Bureau of Labor Statistics, Accessed 2/3/12)
38%: Americans Who Approve Of Obama’s Handling Of The Budget Deficit. (The Washington Post/ABC News Poll, 2/6/12)
36: Record Number Of Straight Months With Unemployment Rate Above 8 Percent. (Bureau of Labor Statistics, Accessed 2/3/12)
34.2%: Households That Receive Either Food Stamps, Subsidized Housing, Cash Welfare Or Medicaid. (The Wall Street Journal, 10/5/11)
32%: Share Of Existing Home Sales In December That Were Distressed Properties (Foreclosures And Short Sales). (National Association Of Realtors, 1/20/12)
29.2%: Unemployed Workers Out Of Work For Over A Year. (Bureau of Labor Statistics, Accessed 2/3/12)
24.4%: Federal Spending As A Share Of GDP By 2022. (CBO, 1/31/12)
22.1%: Home Loans Underwater (Negative Equity) In Third Quarter Of 2011. (Reuters, 11/29/11)
18%: Amount GNP Would Be Lowered Due To Debt’s Effect On Economic Growth By 2035. (CBO, 6/22/11)
17%: Cut To Medicare Benefits When Trust Fund Is Exhausted. (House Ways & Means Committee Hearing, 6/22/11)
15.1%: Workers Unemployed, Underemployed Or Marginally Attached To The Labor Force. (Bureau of Labor Statistics, Accessed 2/3/12)
15.1%: Americans Living In Poverty. (U.S. Census Bureau, 9/13/11)
8.3%: Unemployment Rate. (Bureau of Labor Statistics, Accessed 2/3/12)
8.15%: Percent Of Home Loans Delinquent In November. (Lender Processing Services, 1/27/12)
4.11%: Percent Of Mortgage Loans In Foreclosure During December 2011. (Lender Processing Services, 1/27/12)
2.5%: Decline In Median Home Sale Price In The Last Year. (National Association Of Realtors, 1/20/12)
3: Record +$1 Trillion Deficits On Obama’s Watch. (CBO, 10/7/11)
2.3%: Decline In Median Household Income In 2010. (U.S. Census Bureau, 9/13/11)
0: Other People Obama Will Have Left To Blame For The Failures Of His Economic Policies In 2012. (The American People, 11/6/12)
Compiled by GOP.com
No comments:
Post a Comment